“Where did it all go?” is answerable in about ninety seconds, and almost nobody answers it, because the obvious move — staring at the biggest number — is the wrong one. Rent is always your largest expense and almost never the reason this month felt different. Here is the order that actually works.
Find the overspend
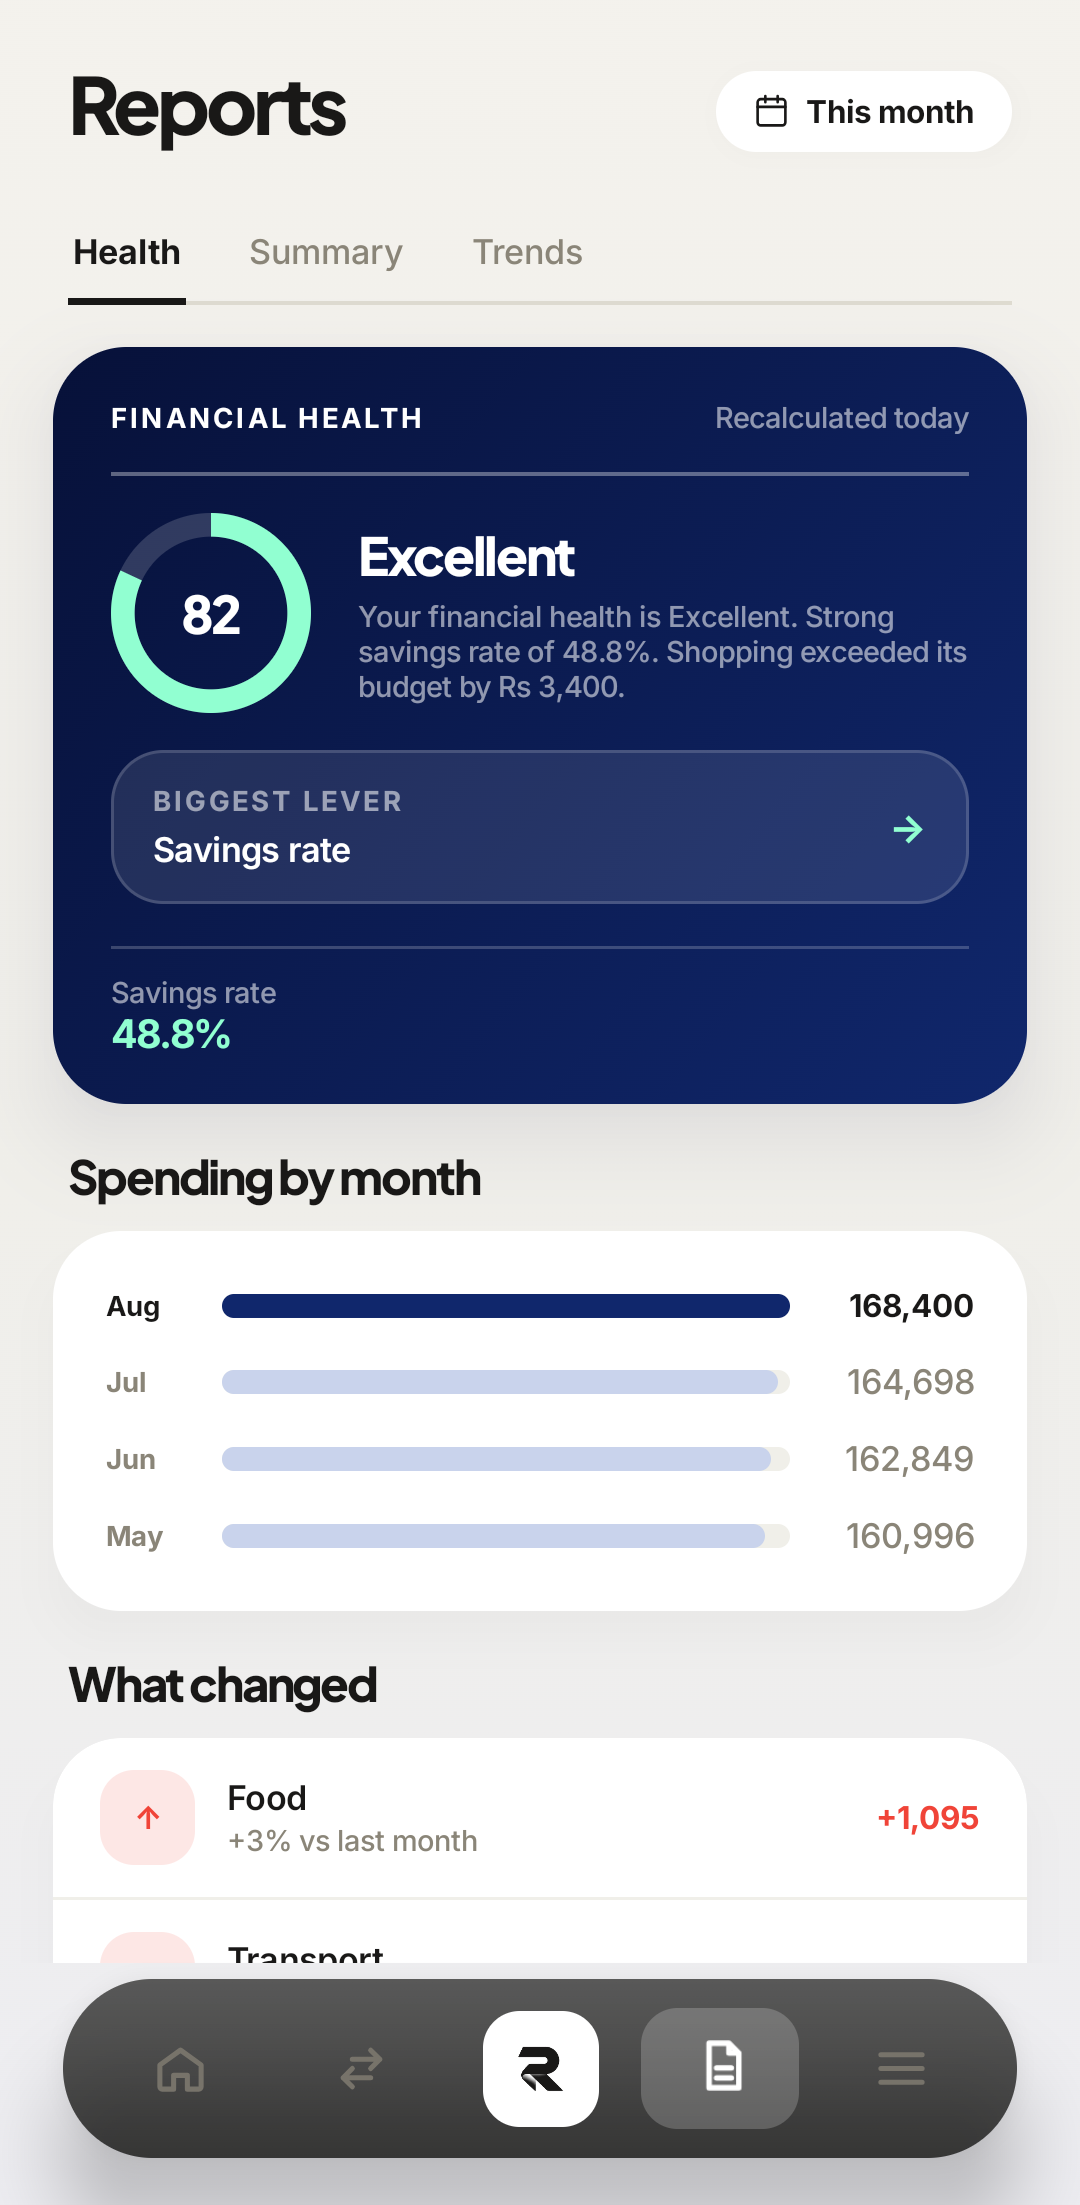
Open Reports and set the period
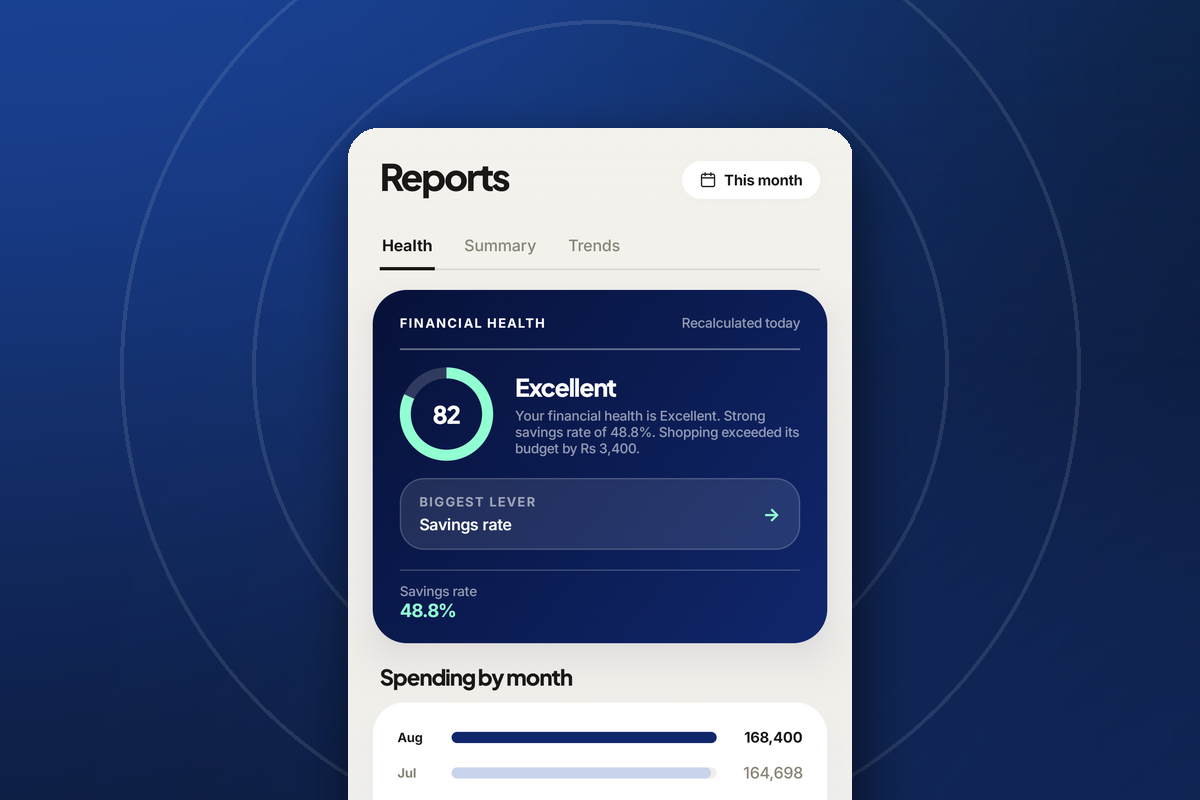
Tap the document icon in the bottom navigation bar, fourth of five. Then check the pill in the top-right — This month — because every figure below it obeys that setting.
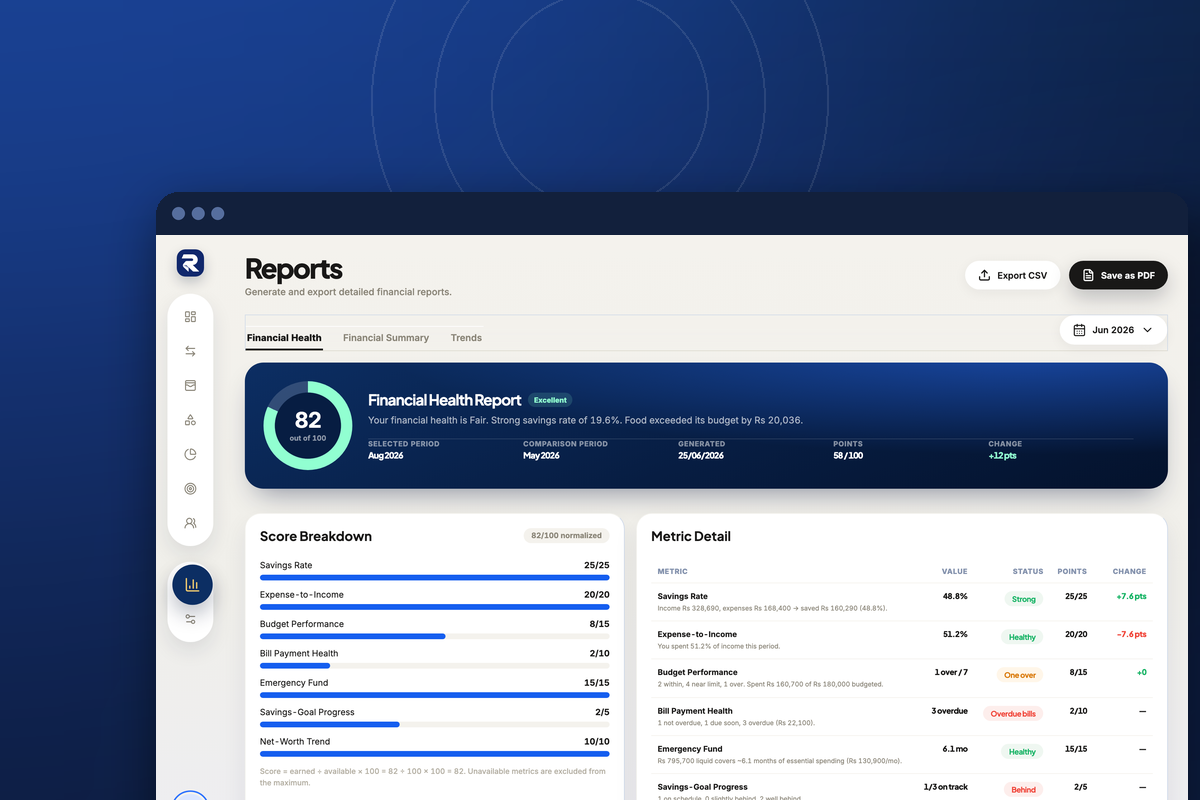
Click the bar-chart icon in the left sidebar, below the divider. Then check the month picker in the top-right, and the comparing against line under it: that is what every “vs last period” figure on the page is measured from.
 1Period2
Reports is on the bottom bar — one of only four screens that is. 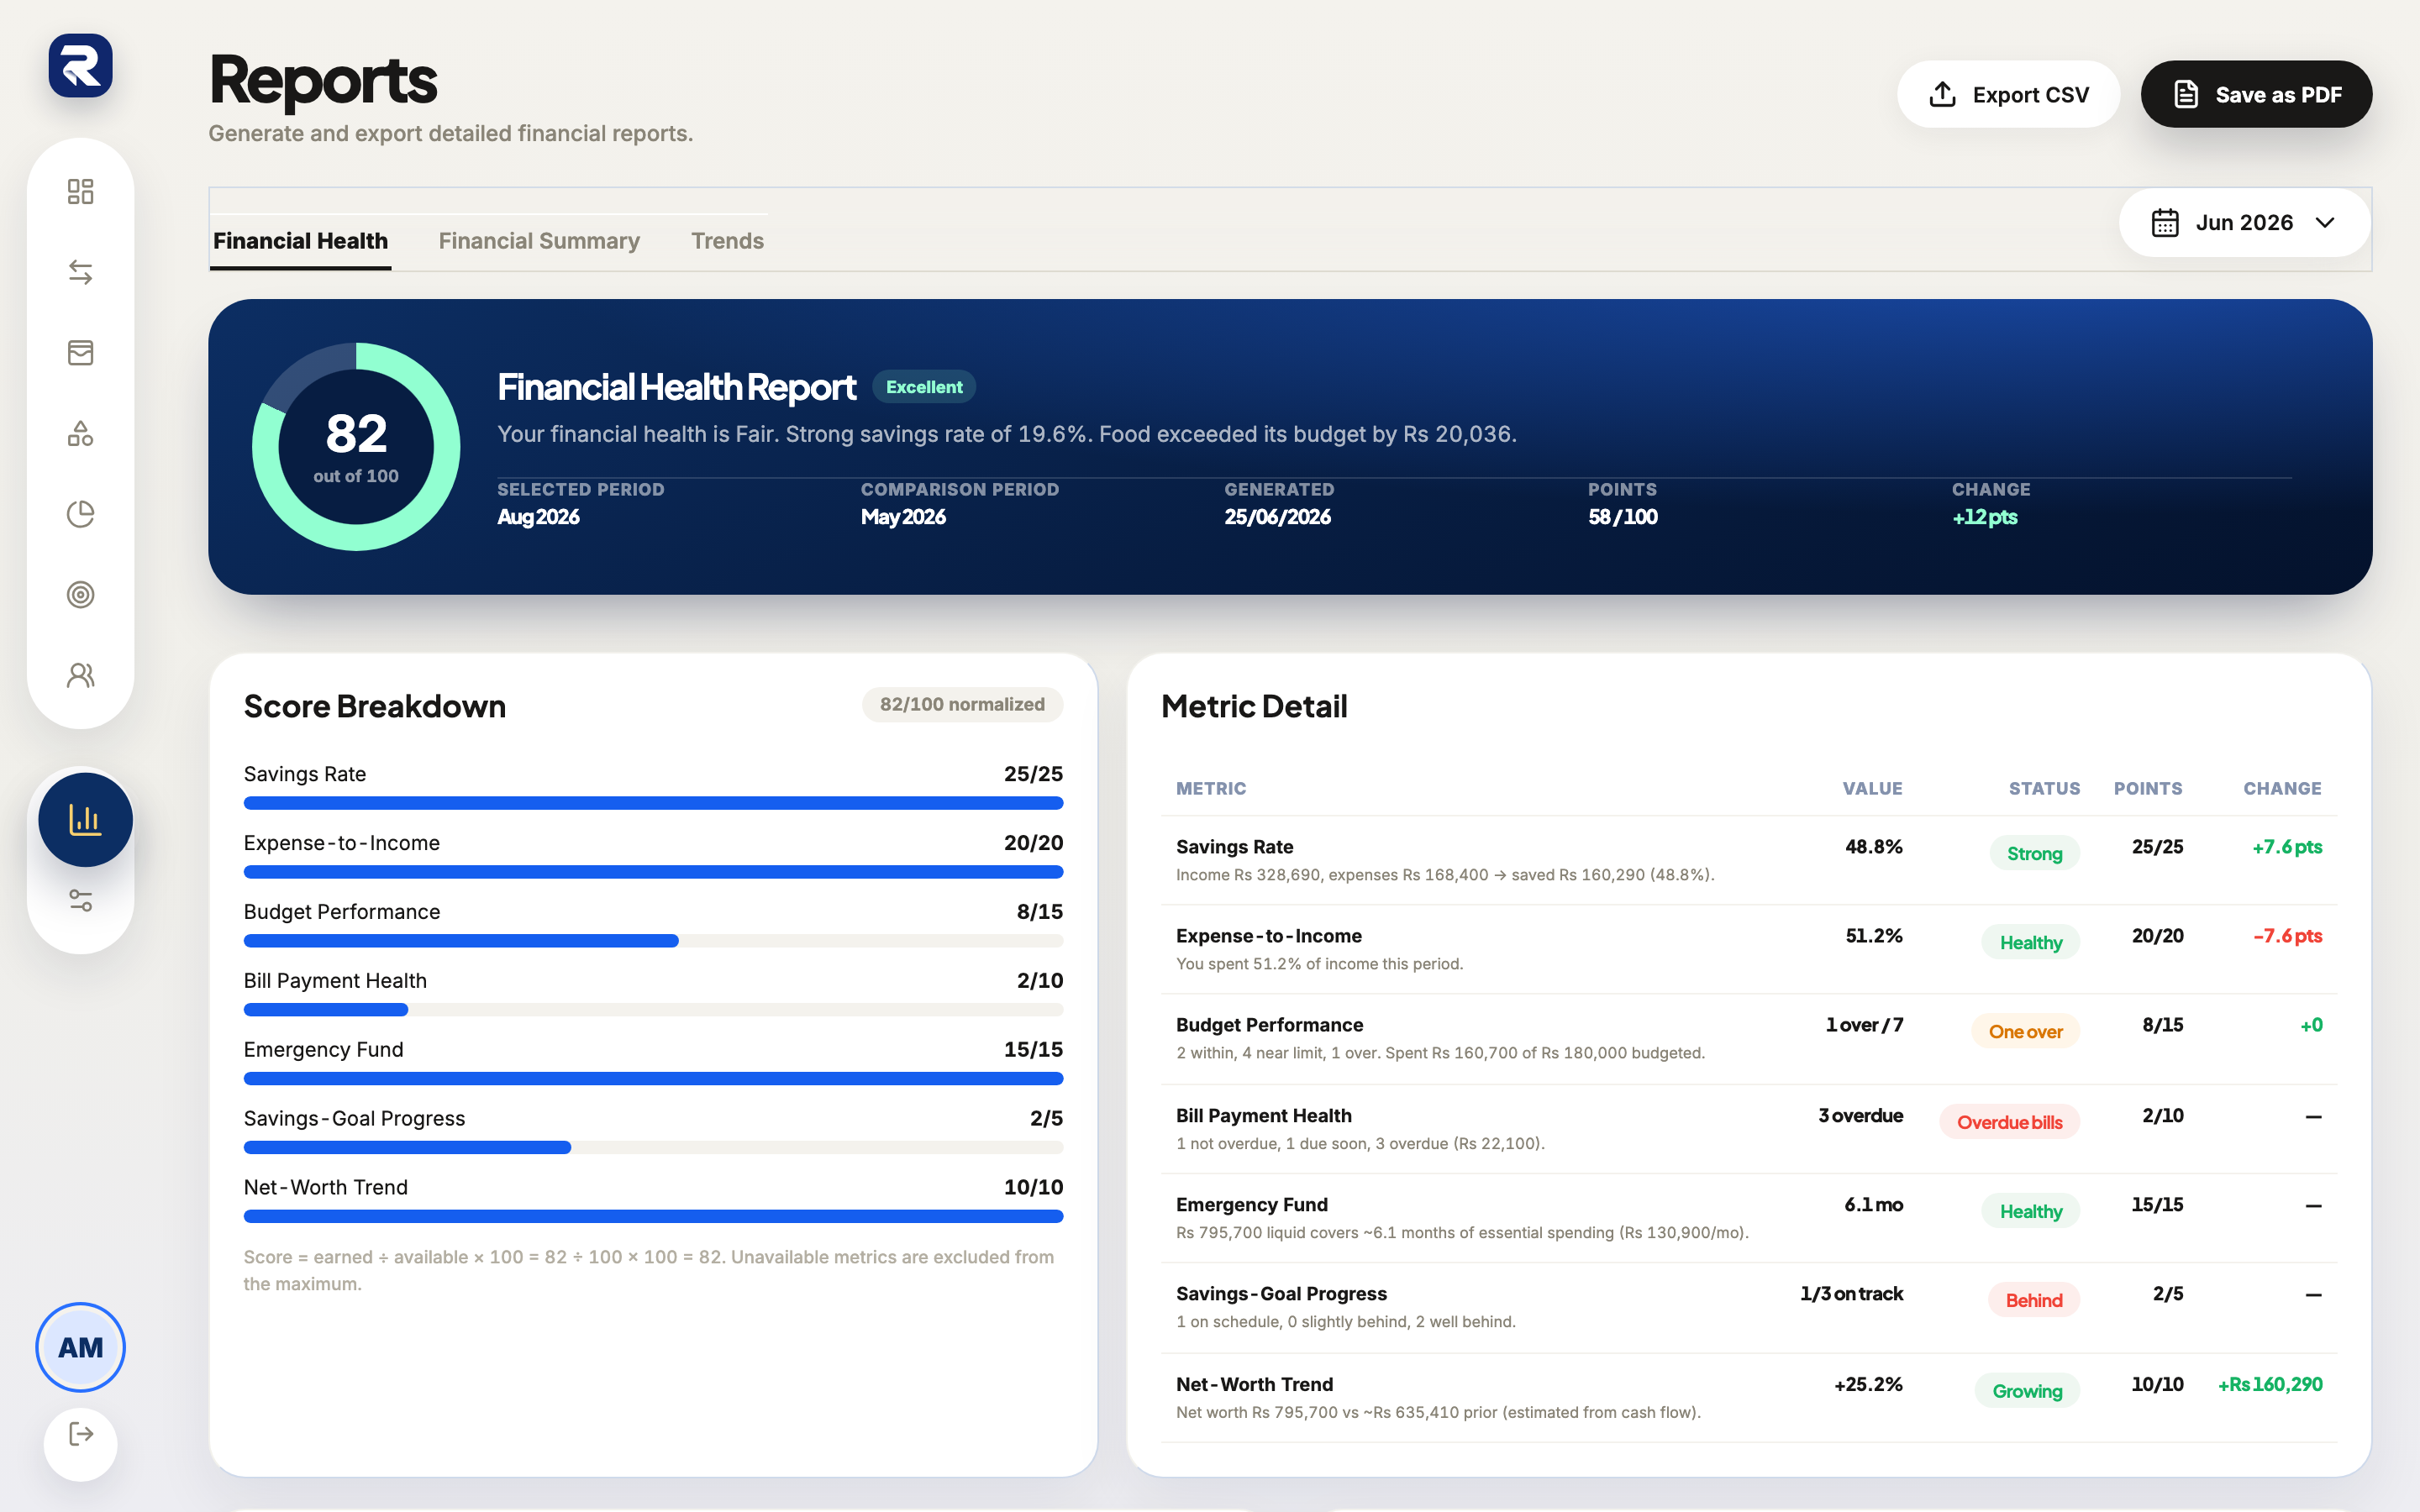 1Tabs2Period
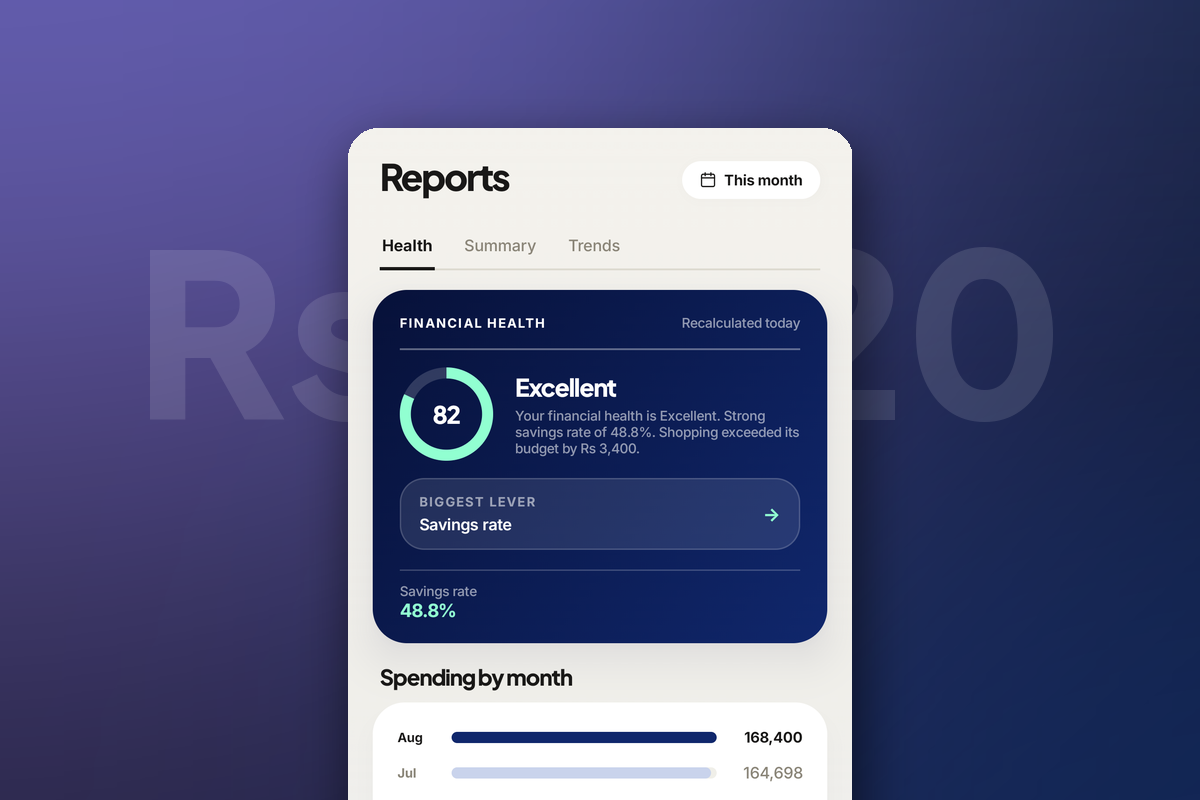
Three tabs on one period: Financial Health, Financial Summary, Trends. Read the health summary first
The sentence at the top of the health card is the whole report compressed: “Your financial health is Excellent. Strong savings rate of 48.8%. Shopping exceeded its budget by Rs 3,400.” It has already done the step most people skip — it names the category that broke.
Read it before you look at any chart. Half the time it tells you exactly what you came to find out, and the rest of this is confirmation.
12Biggest leverScore, verdict, and the one-line explanation — plus Biggest lever, which is the metric that would move the score most. 12The summaryThe web card adds the comparison period, the points earned, and the change since last time. Find the category that changed
Not the largest — the one that moved. A category that is always big tells you nothing new; a category that is up 3% on last month is the reason the month felt different.
Scroll to What changed. Each row is a category with its movement against last month and the rupee difference, ordered by how much it moved.
Open the Financial Summary tab, or read the category breakdown on your dashboard. Both carry the same per-category comparison.
1By month2What changedSpending by month first — is this month unusual at all? — then What changed, for which category did it. 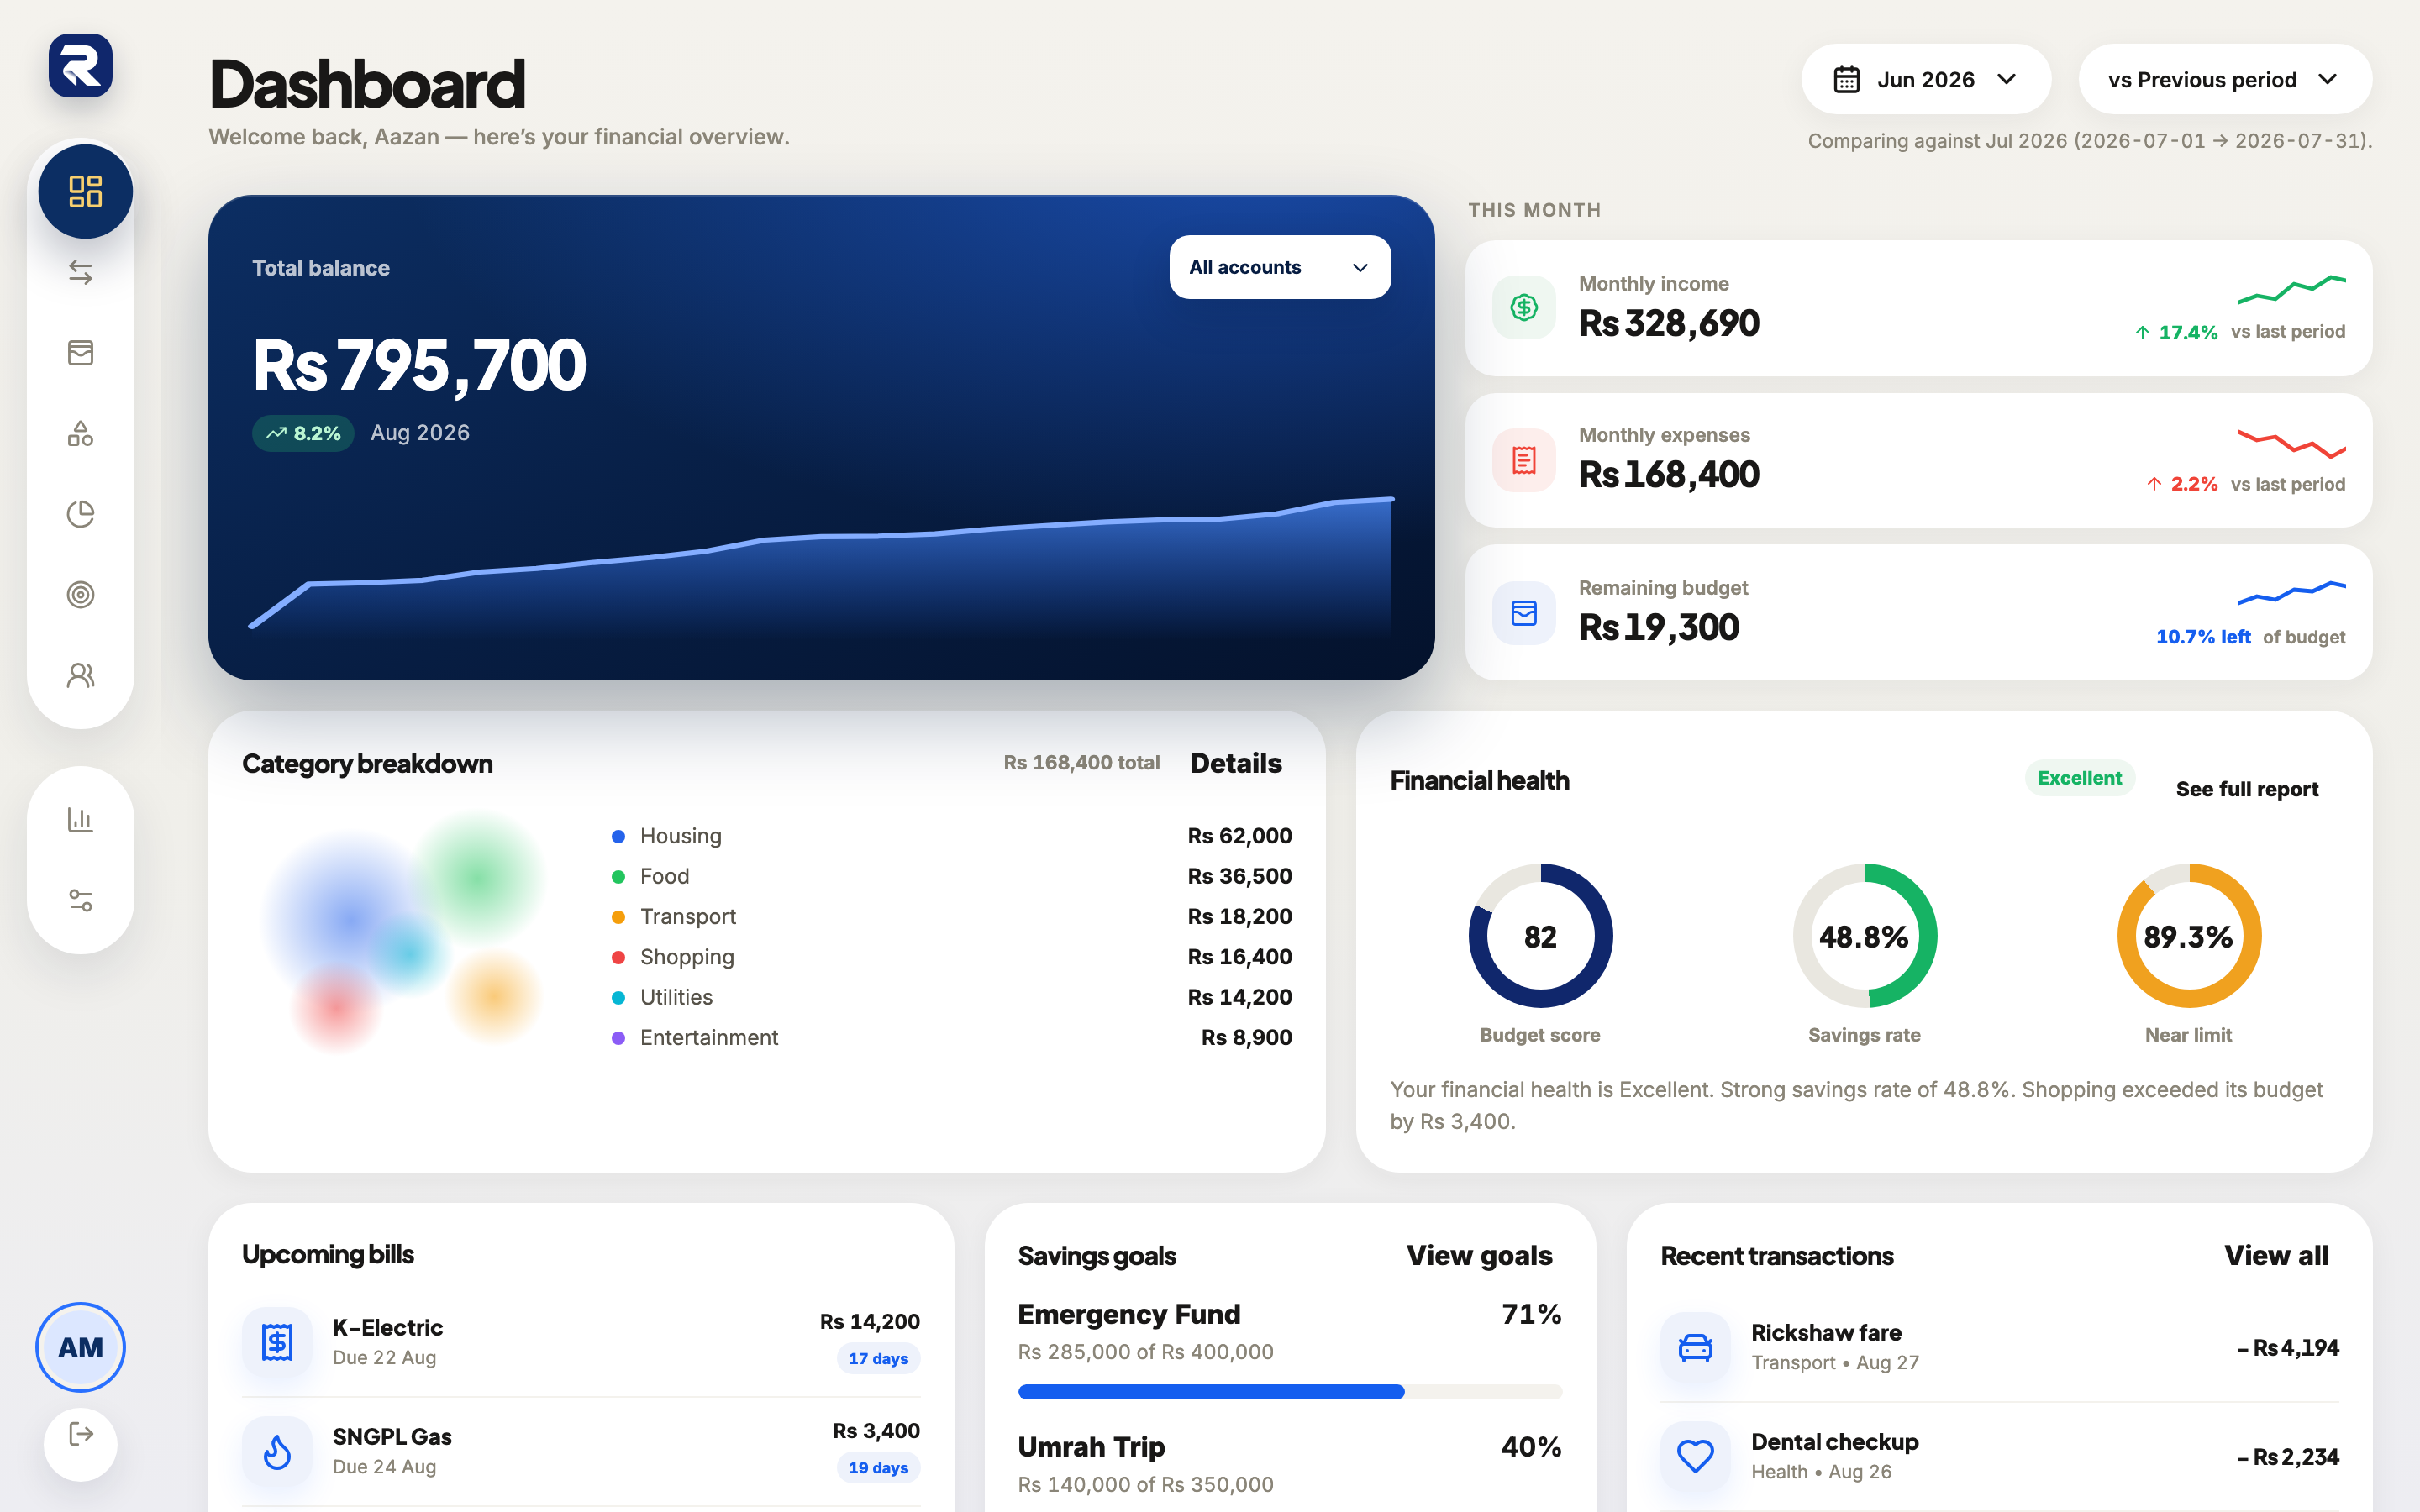 Category breakdown
The dashboard's category breakdown is the same data in one glance — six categories, largest first. Check budget performance for the same category
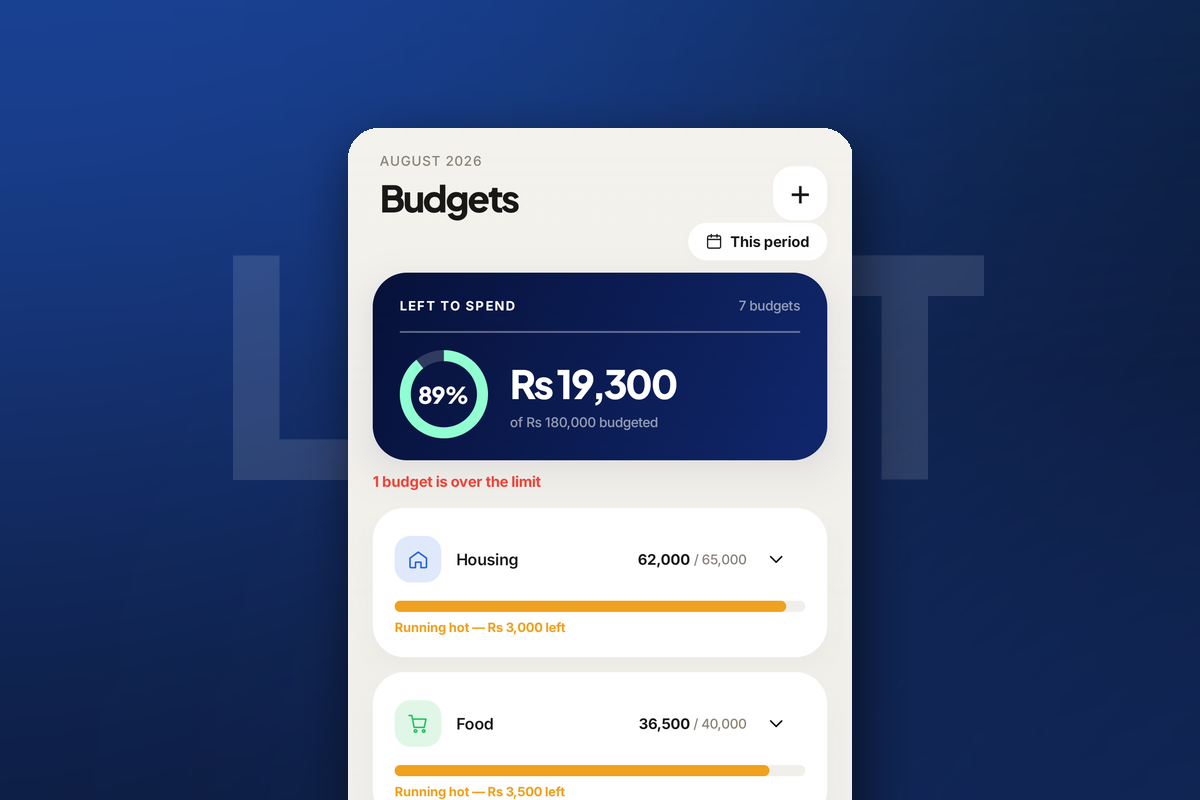
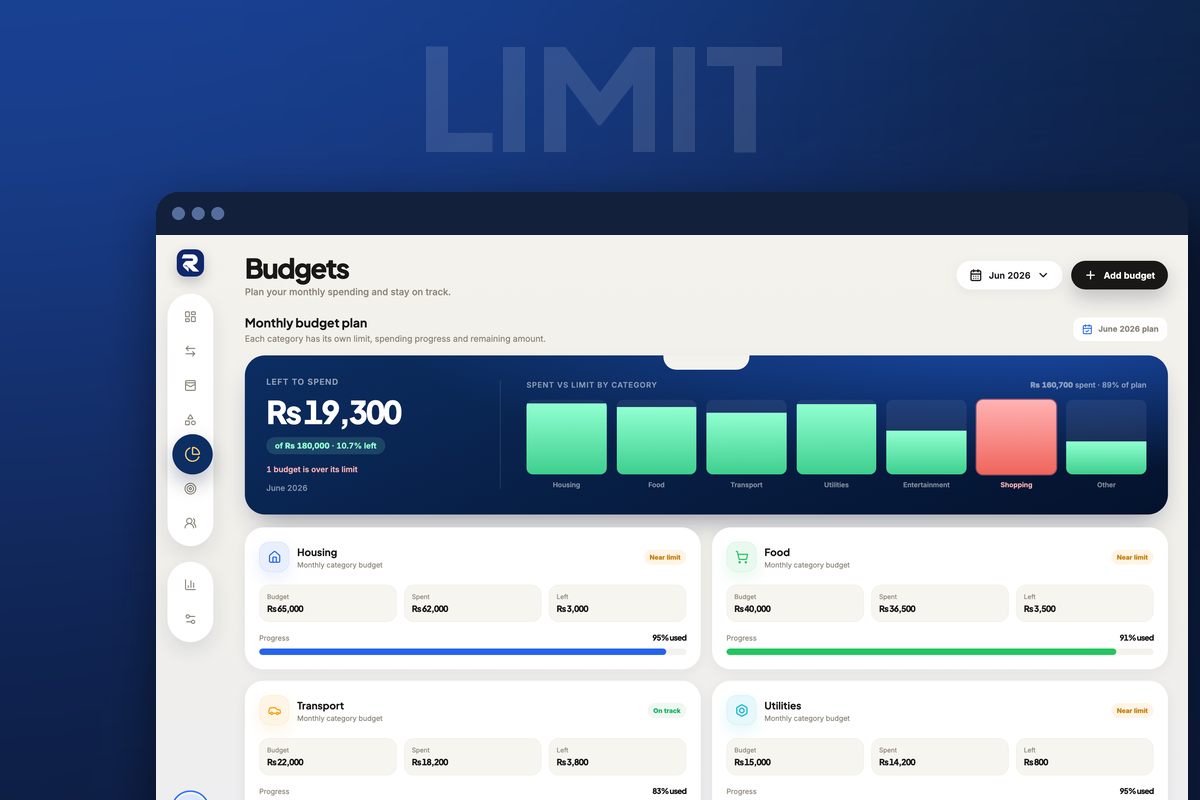
A category can rise for a good reason. What makes it a problem is rising past a limit you set — so the next question is whether that category has a budget and whether it broke it.
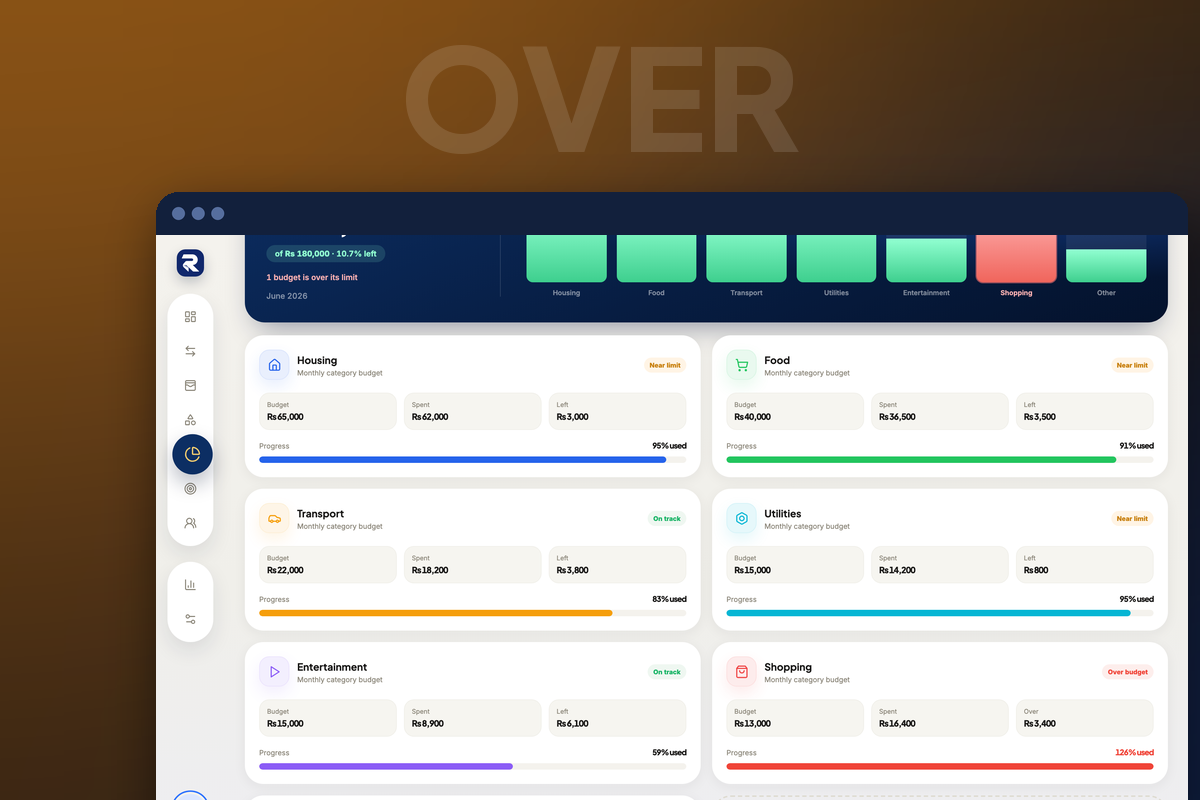
Metric Detail on the Financial Health tab spells it out: 2 within, 4 near limit, 1 over. Spent Rs 160,700 of Rs 180,000 budgeted.
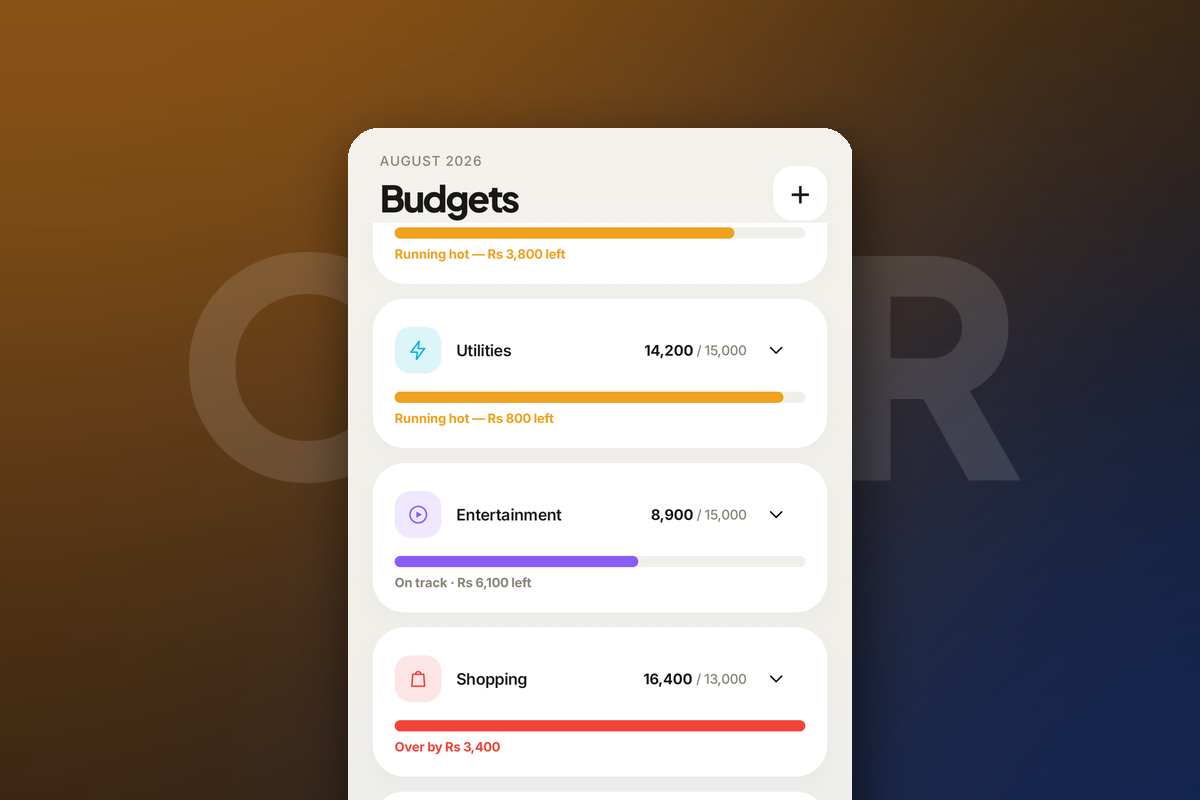
Open Budgets from the menu. The warning line under the summary card counts the budgets that are already over.
1Budget performance2Every metric shows its value, its status, the points it earned, and which direction it moved. 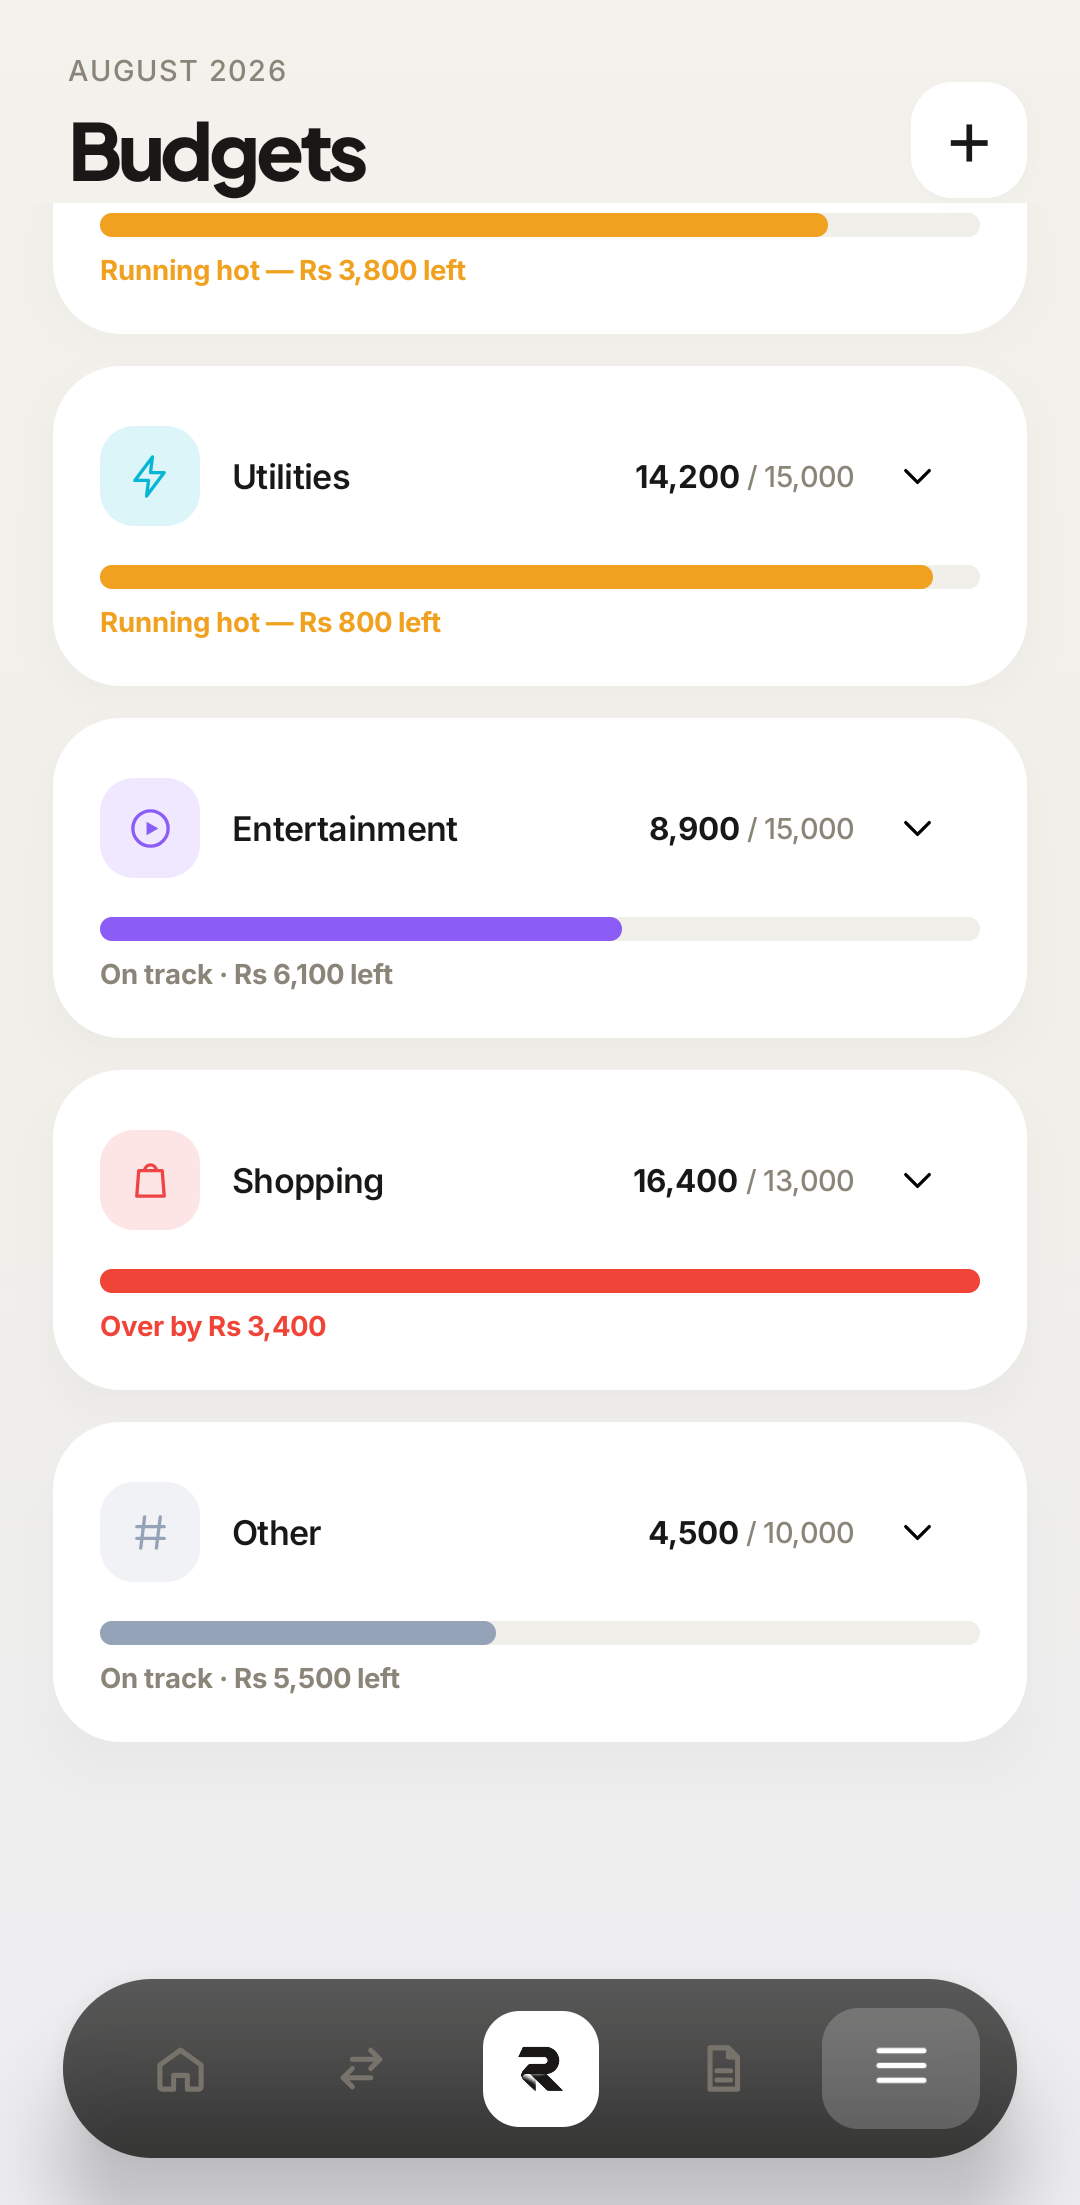 Over budget
Over by Rs 3,400 on Shopping — the same category the health summary named. Open the transactions behind it
This is the step that turns a number into a decision. Filter Transactions to that category for the period and look at the rows, because the same Rs 3,400 overage means two completely different things: one large purchase you already knew about, or thirty small ones you did not.
One outlier means the budget is fine and the month was not. Thirty small ones mean the budget is wrong.
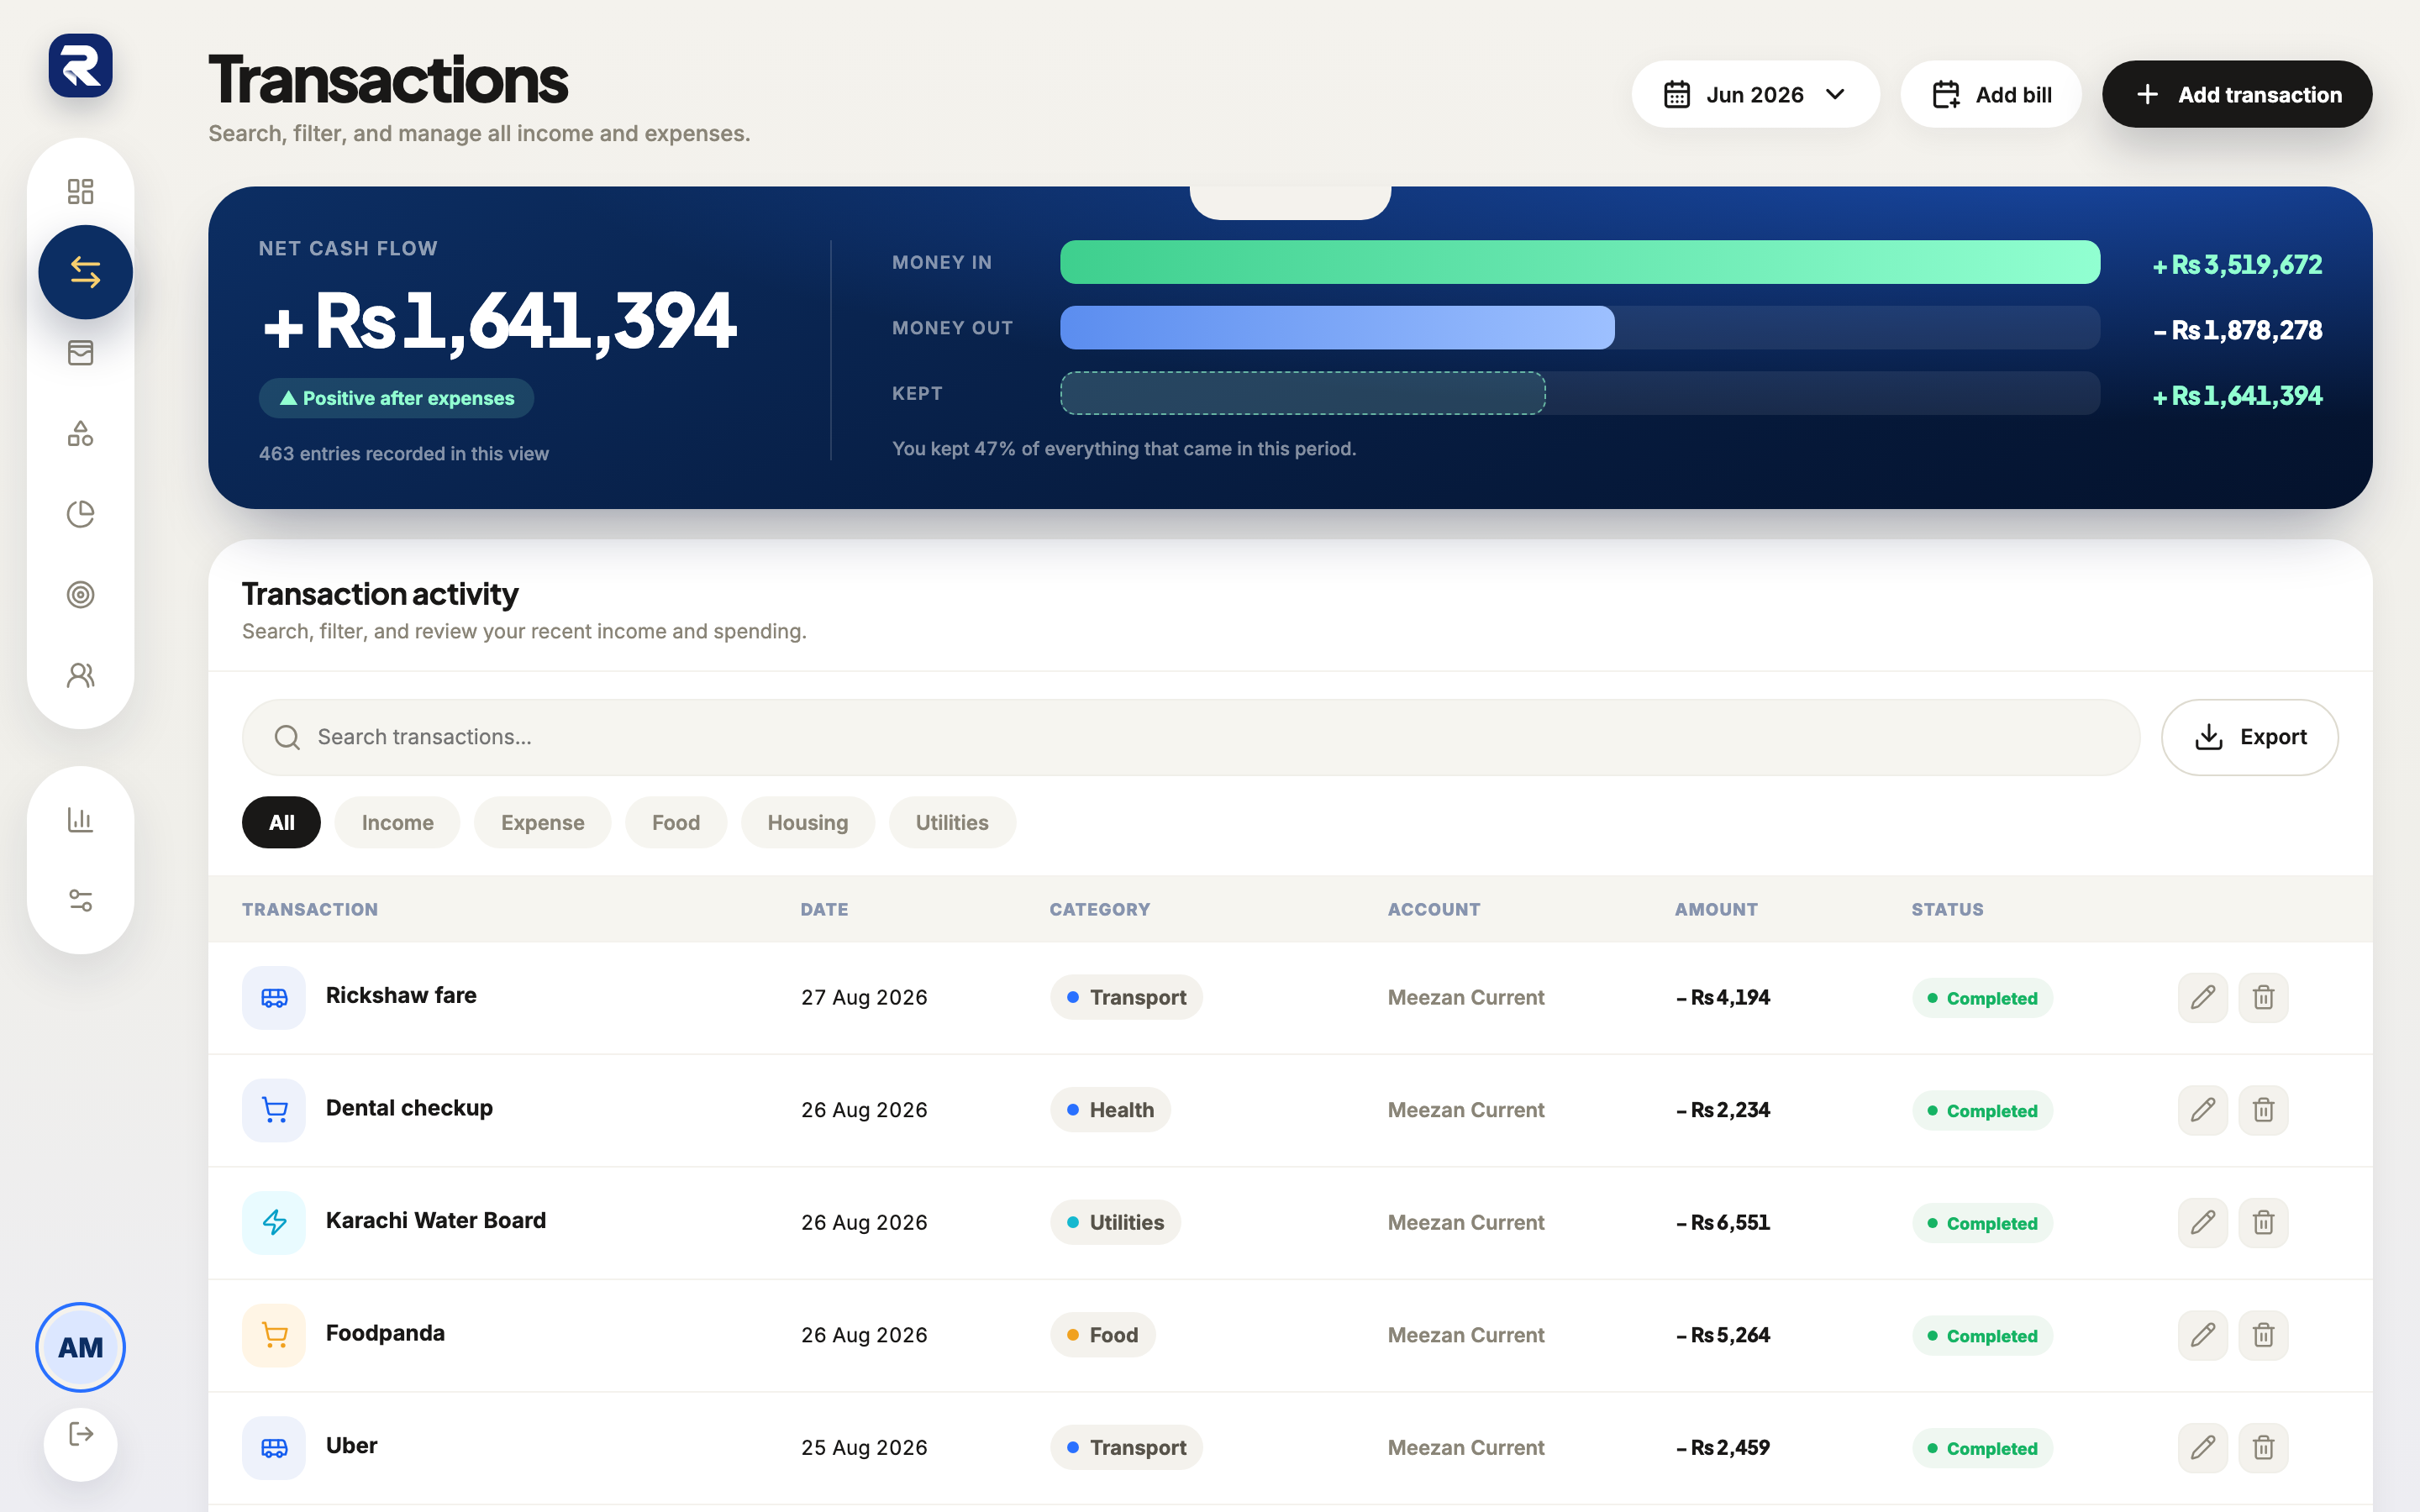 1Search2
Filter by category, then scan the amounts column — the shape of the list is the answer. 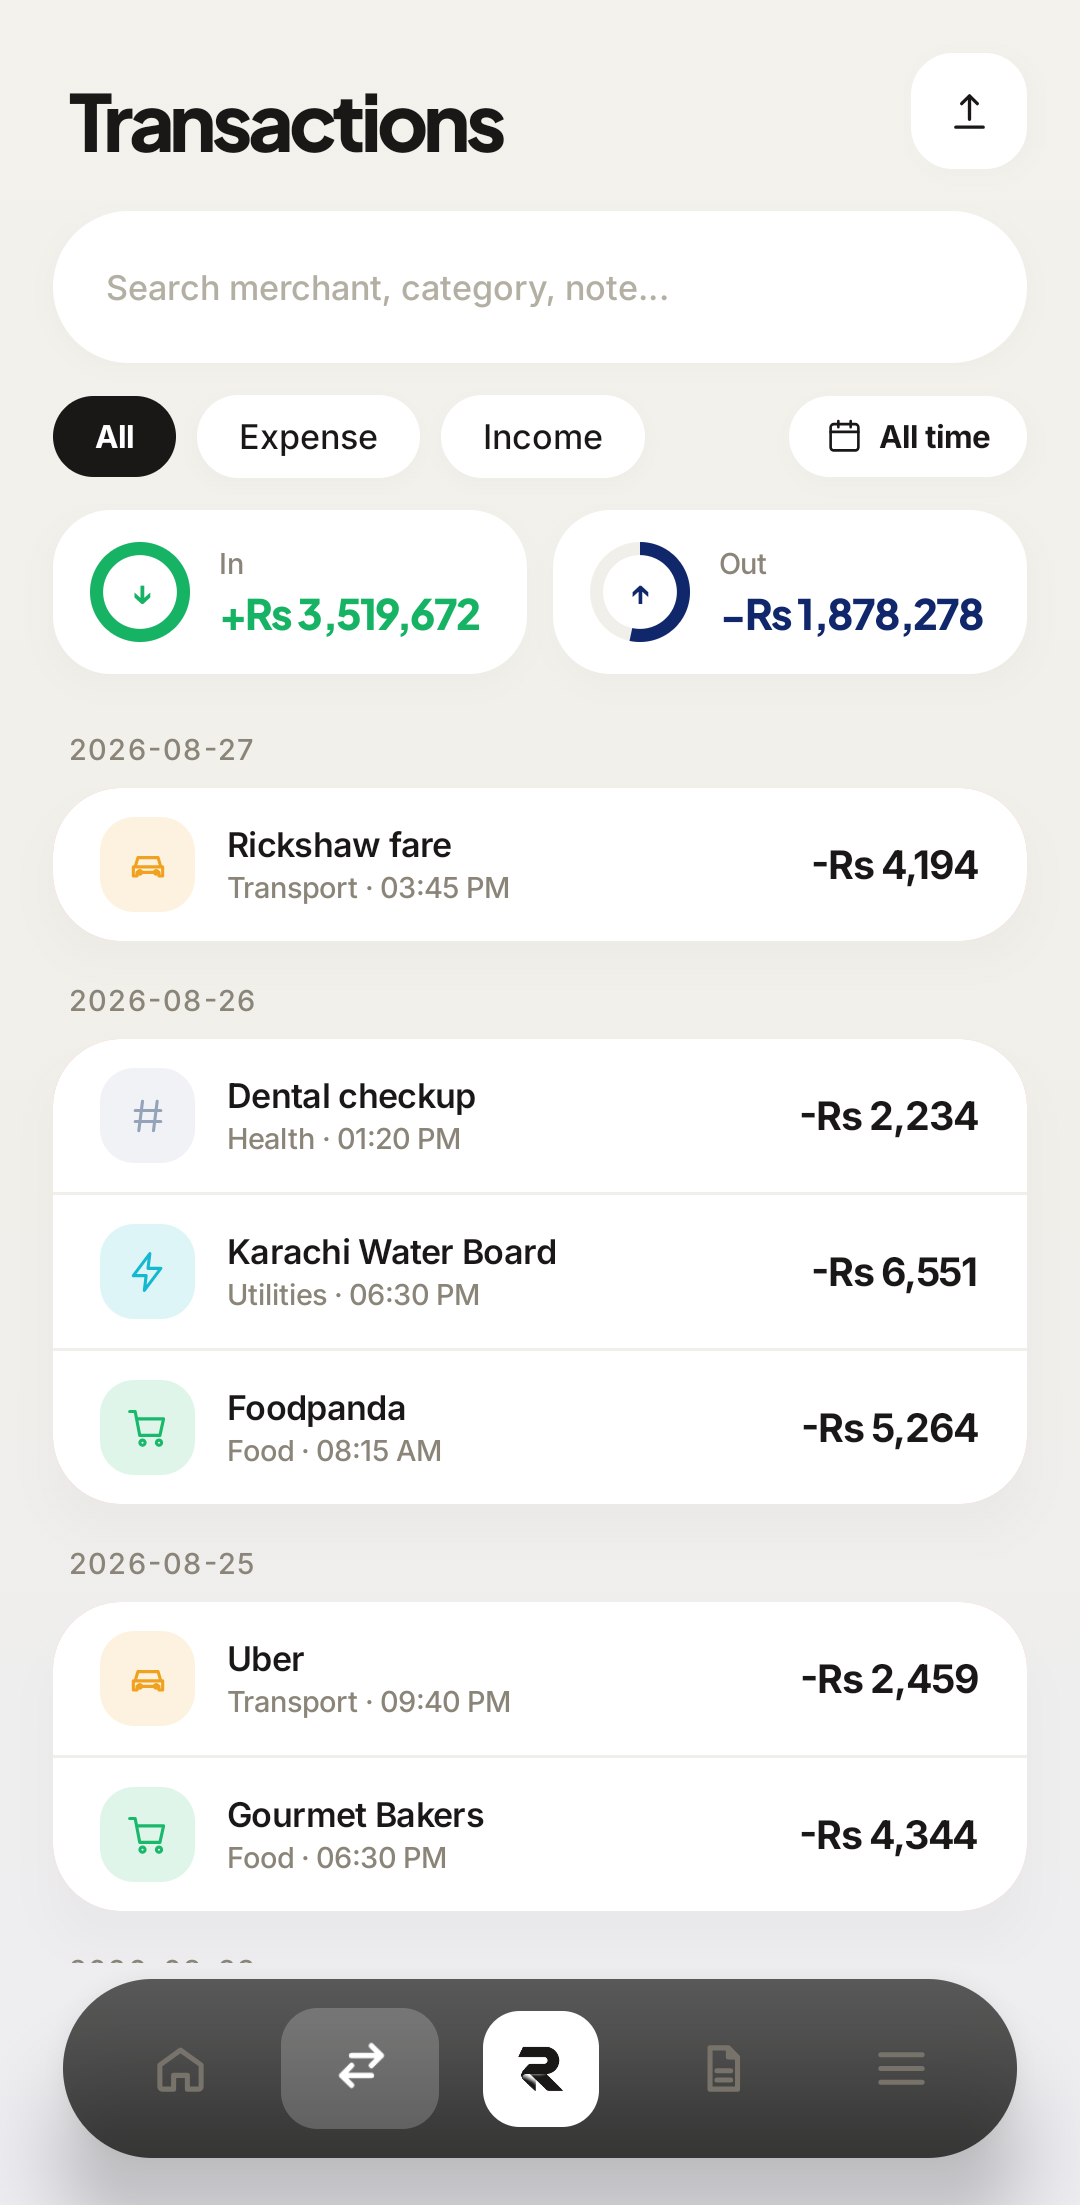 The evidence
One Rs 9,000 row and thirty Rs 300 rows are the same total and call for opposite responses.
You should be able to finish this sentence with specifics: “This month cost more because ___ was up Rs ___, which took it Rs ___ over its budget, and it was [one purchase / a lot of small ones].” If you cannot, you stopped at a chart. The transactions are the only place the last clause exists.
Reading the health score
The score is seven metrics with different weights, and the breakdown matters more than the number. Savings Rate is worth 25 points, Expense-to-Income 20, Budget Performance 15, Emergency Fund 15, Bill Payment Health 10, Net-Worth Trend 10, Savings-Goal Progress 5.
Which is why a good month can score badly. Three overdue bills cost 8 of the 10 available points regardless of how carefully you spent — and no amount of frugality fixes a metric that is not about spending.
1Breakdown2DetailBiggest leverPace, not totals
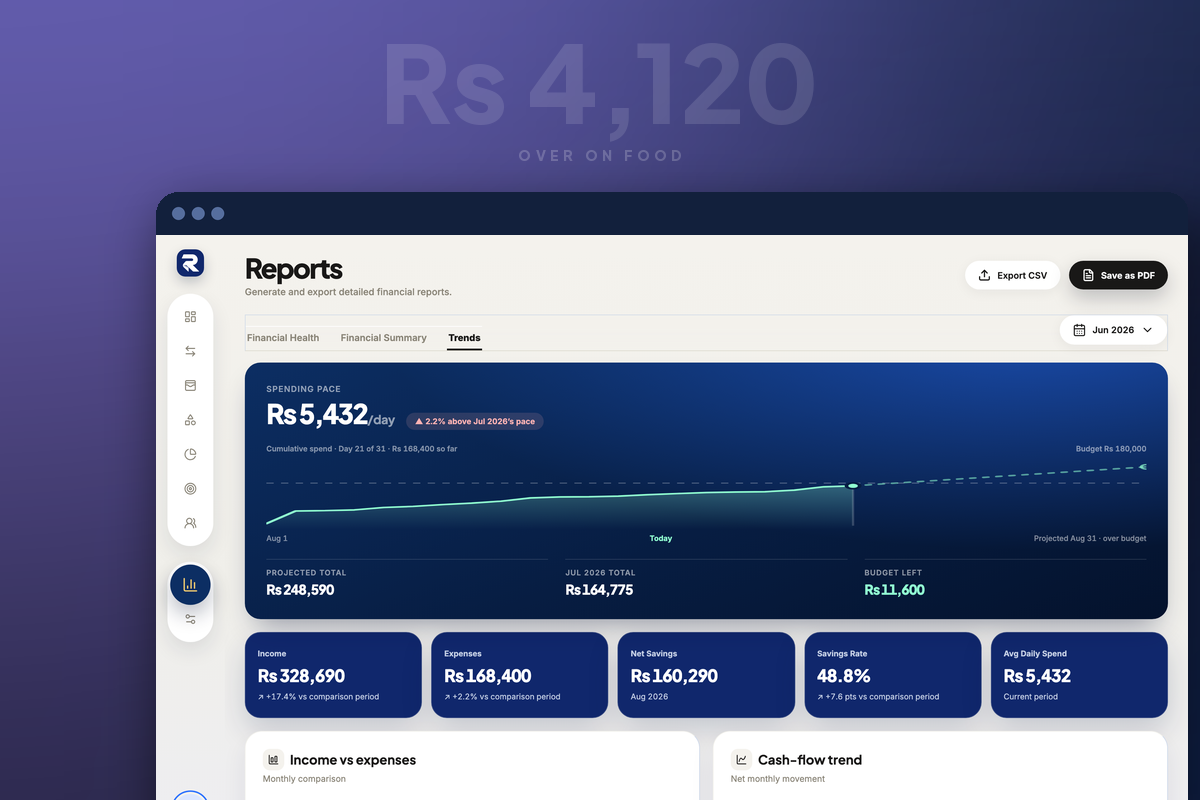
A total tells you what already happened. On the 21st of the month, what you want is whether the rest of it is going to hold — and that is a rate, not a sum. The Trends tab on the web app answers it directly: spending per day, cumulative spend against the budget line, and a projection to the end of the month.
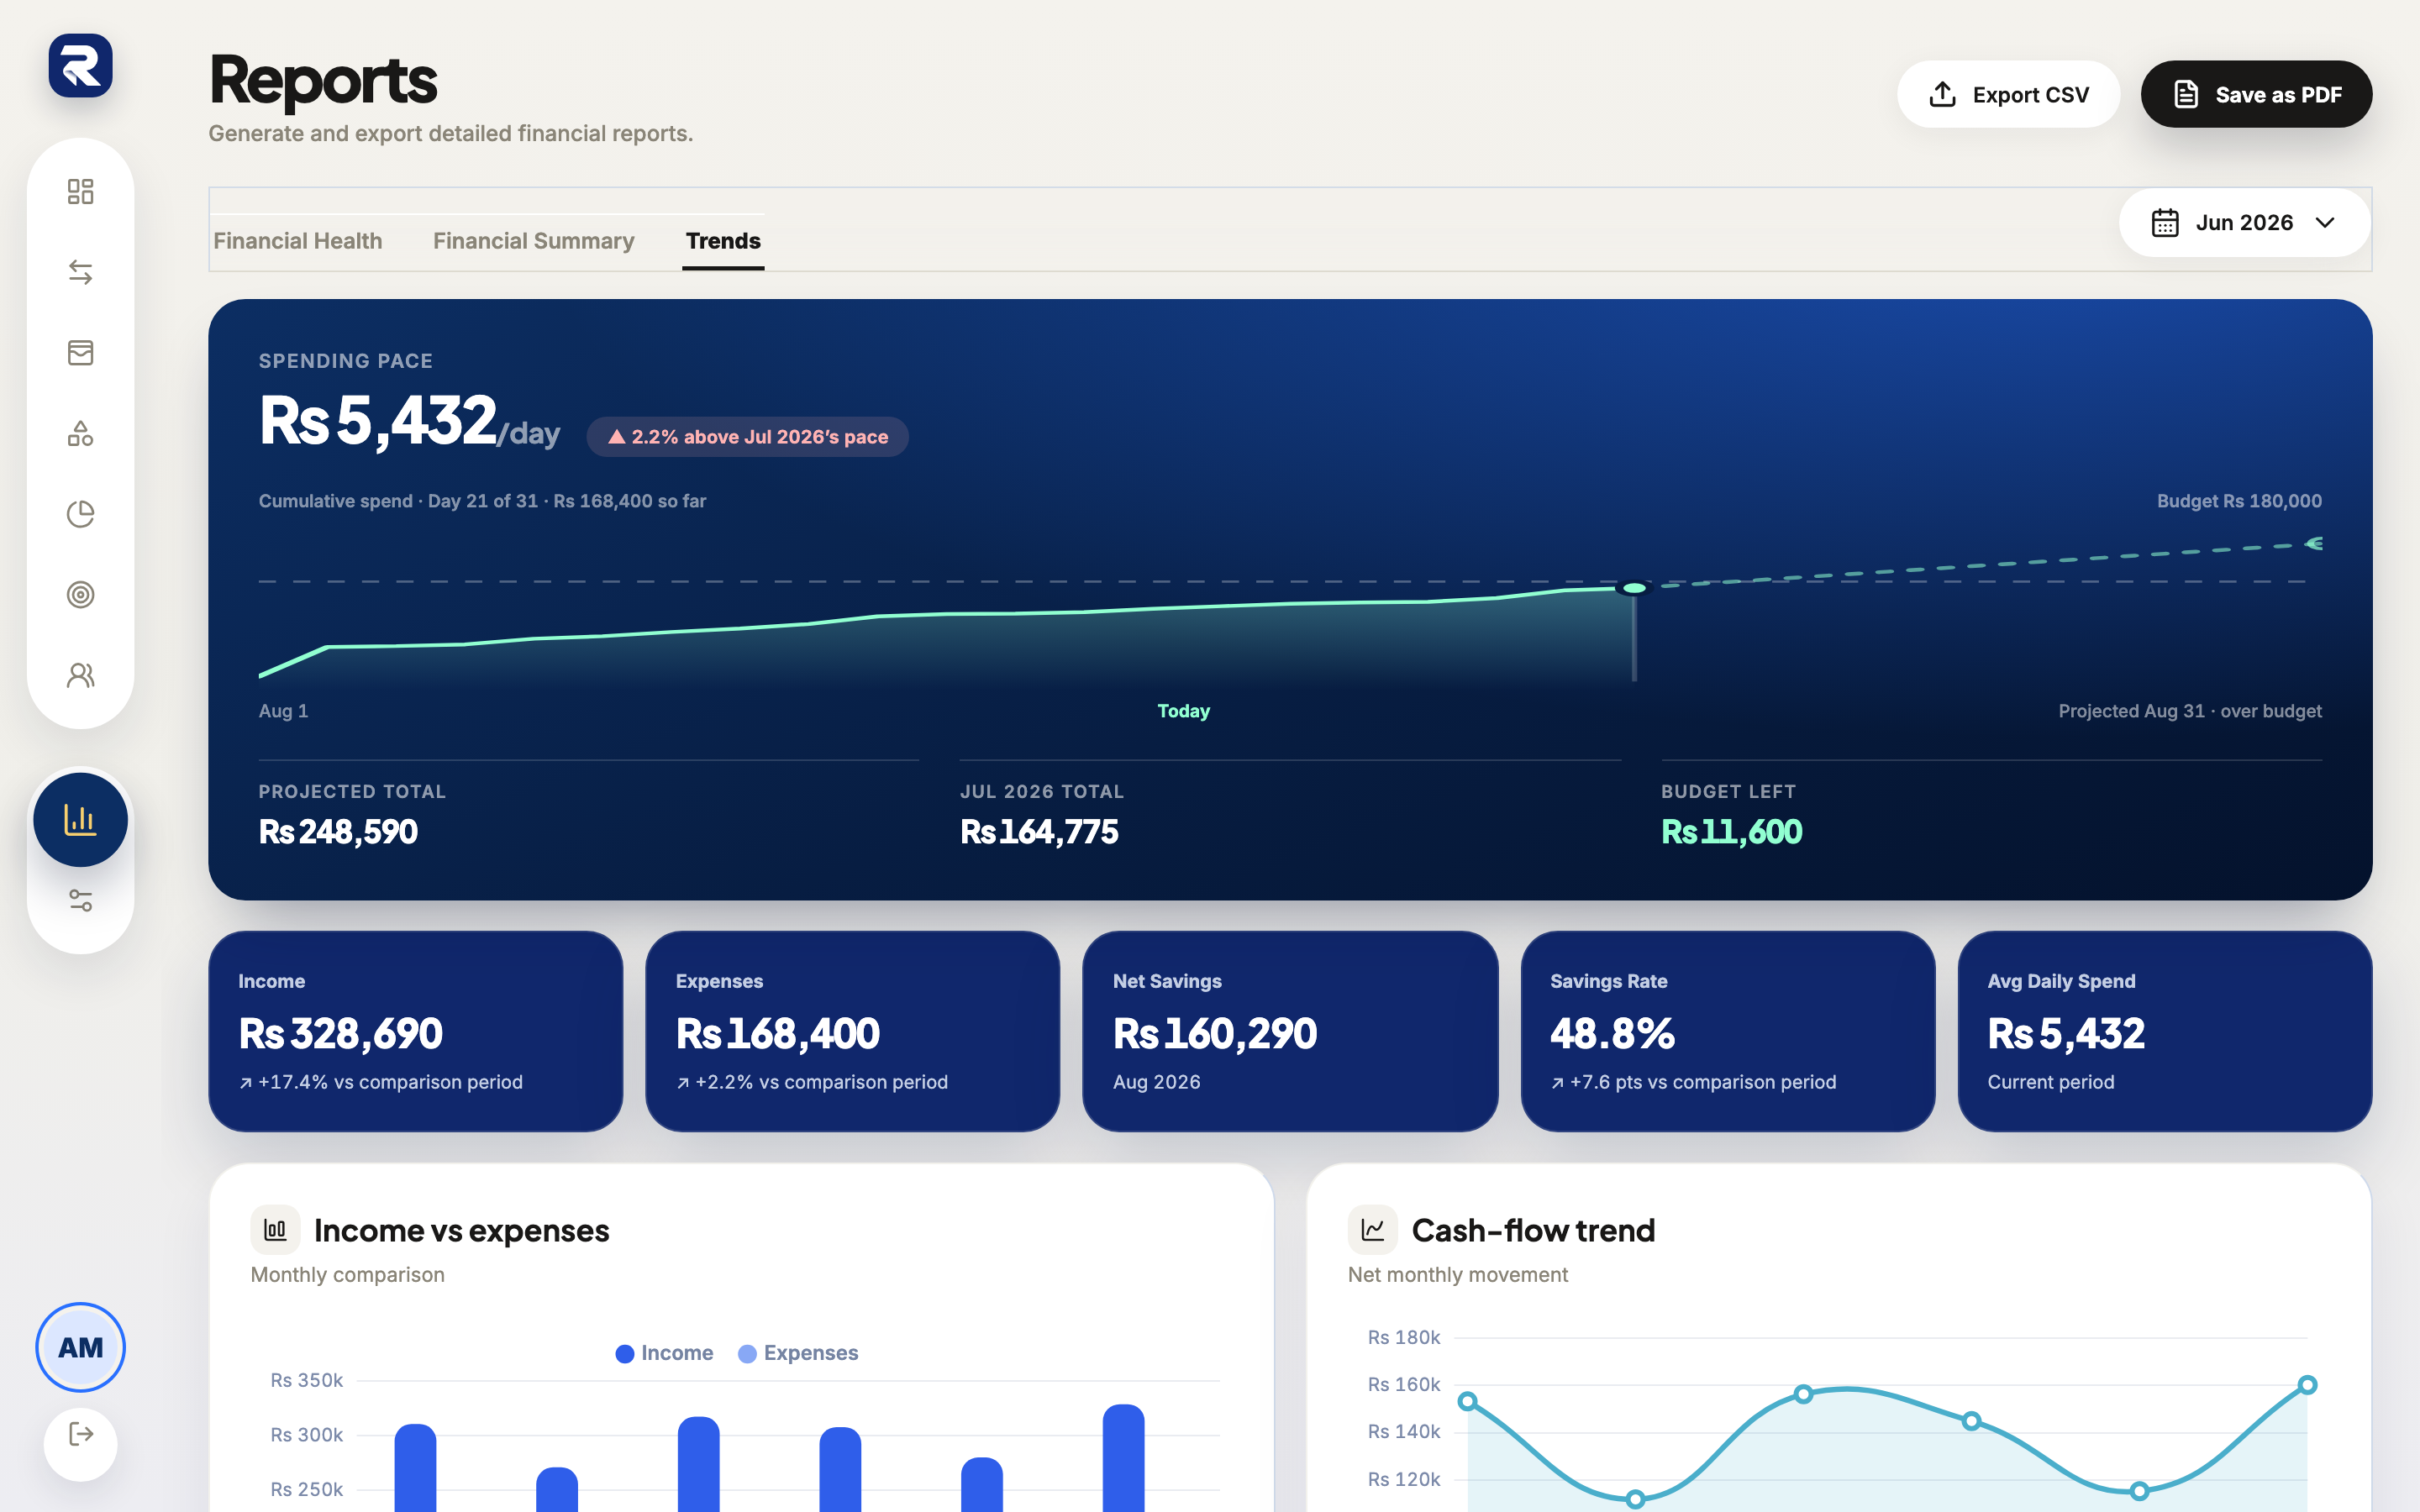 1Daily pace2Projected31Trends2
Taking it with you
Export CSV and Save as PDF sit at the top of the web Reports screen. The PDF keeps the layout, which is what you want if you are showing somebody. The CSV is what you want if you disagree with the arithmetic and would rather check it yourself.
1Export CSV2Frequently asked questions
What is a financial health score?
A single number out of 100, built from seven weighted metrics — savings rate, expense-to-income, budget performance, bill payments, emergency fund, goal progress, and net-worth trend. It is a prompt to investigate, not a verdict.
Why did my spending rise without a big purchase?
Usually several small increases across categories rather than one visible event. What changed compares this period against the last one per category, which is the fastest way to see which of them moved.
What period do reports cover?
Whatever the period control at the top is set to, and every figure on the screen — including the comparison — follows it. If the numbers look wrong, check the period before you check anything else.
Can I get the report out of Rakama?
The web app has Export CSV and Save as PDF at the top of the Reports screen. The PDF keeps the layout; the CSV is for doing your own arithmetic.
Why is my score lower than last month when I spent less?
Spending is one of seven inputs. An overdue bill or a savings goal falling behind can pull the score down in a month your spending genuinely improved — open the metric detail and the breakdown will say which.
Make your money easier to understand.
Track expenses, plan budgets, and keep your goals in one clear view with Rakama.
Try Rakama free ↗