
Almost every number in a personal ledger degrades over time. Amounts shrink in real terms, categories drift, comparisons rot as prices move. One figure holds its meaning across all of it, and it is not the one most apps put on the dashboard.
Why this number and not another
A savings rate is a ratio of two quantities measured in the same units, over the same period. That structure is what makes it durable.
| Number | Survives inflation? | Survives a variable income? |
|---|---|---|
| Amount saved this month | No | No |
| Total spending | No | Partly |
| Net worth | No | Yes |
| Savings rate | Yes | Over a long enough period |
When prices rise thirty percent, the amount you save and the amount you earn are both measured in the same shrinking rupee, so the ratio between them is unaffected. When your income doubles for one month, the rate for that month is distorted but the rate across twelve months is not.
What counts on each side
The ratio is only as good as its definitions, and this is where most people accidentally flatter themselves.
Income — the numerator’s denominator
Money that arrived and was yours to keep. Salary, client payments, and genuine windfalls. Not transfers between your own accounts, not a committee payout, not a loan received, not money repaid to you that you had lent out. Every one of those inflates income without adding anything you earned.
Saved — what did not get spent
Income minus spending, over the same period. Not the total that arrived in your savings account — that number is dominated by transfers, and a transfer from current to savings is not saving, it is a change of address.
The distinction matters because it is easy to construct an impressive-looking savings number by moving Rs 100,000 into a savings account on the 1st and moving it back on the 20th. Income minus spending is immune to that; the balance of a savings account is not.
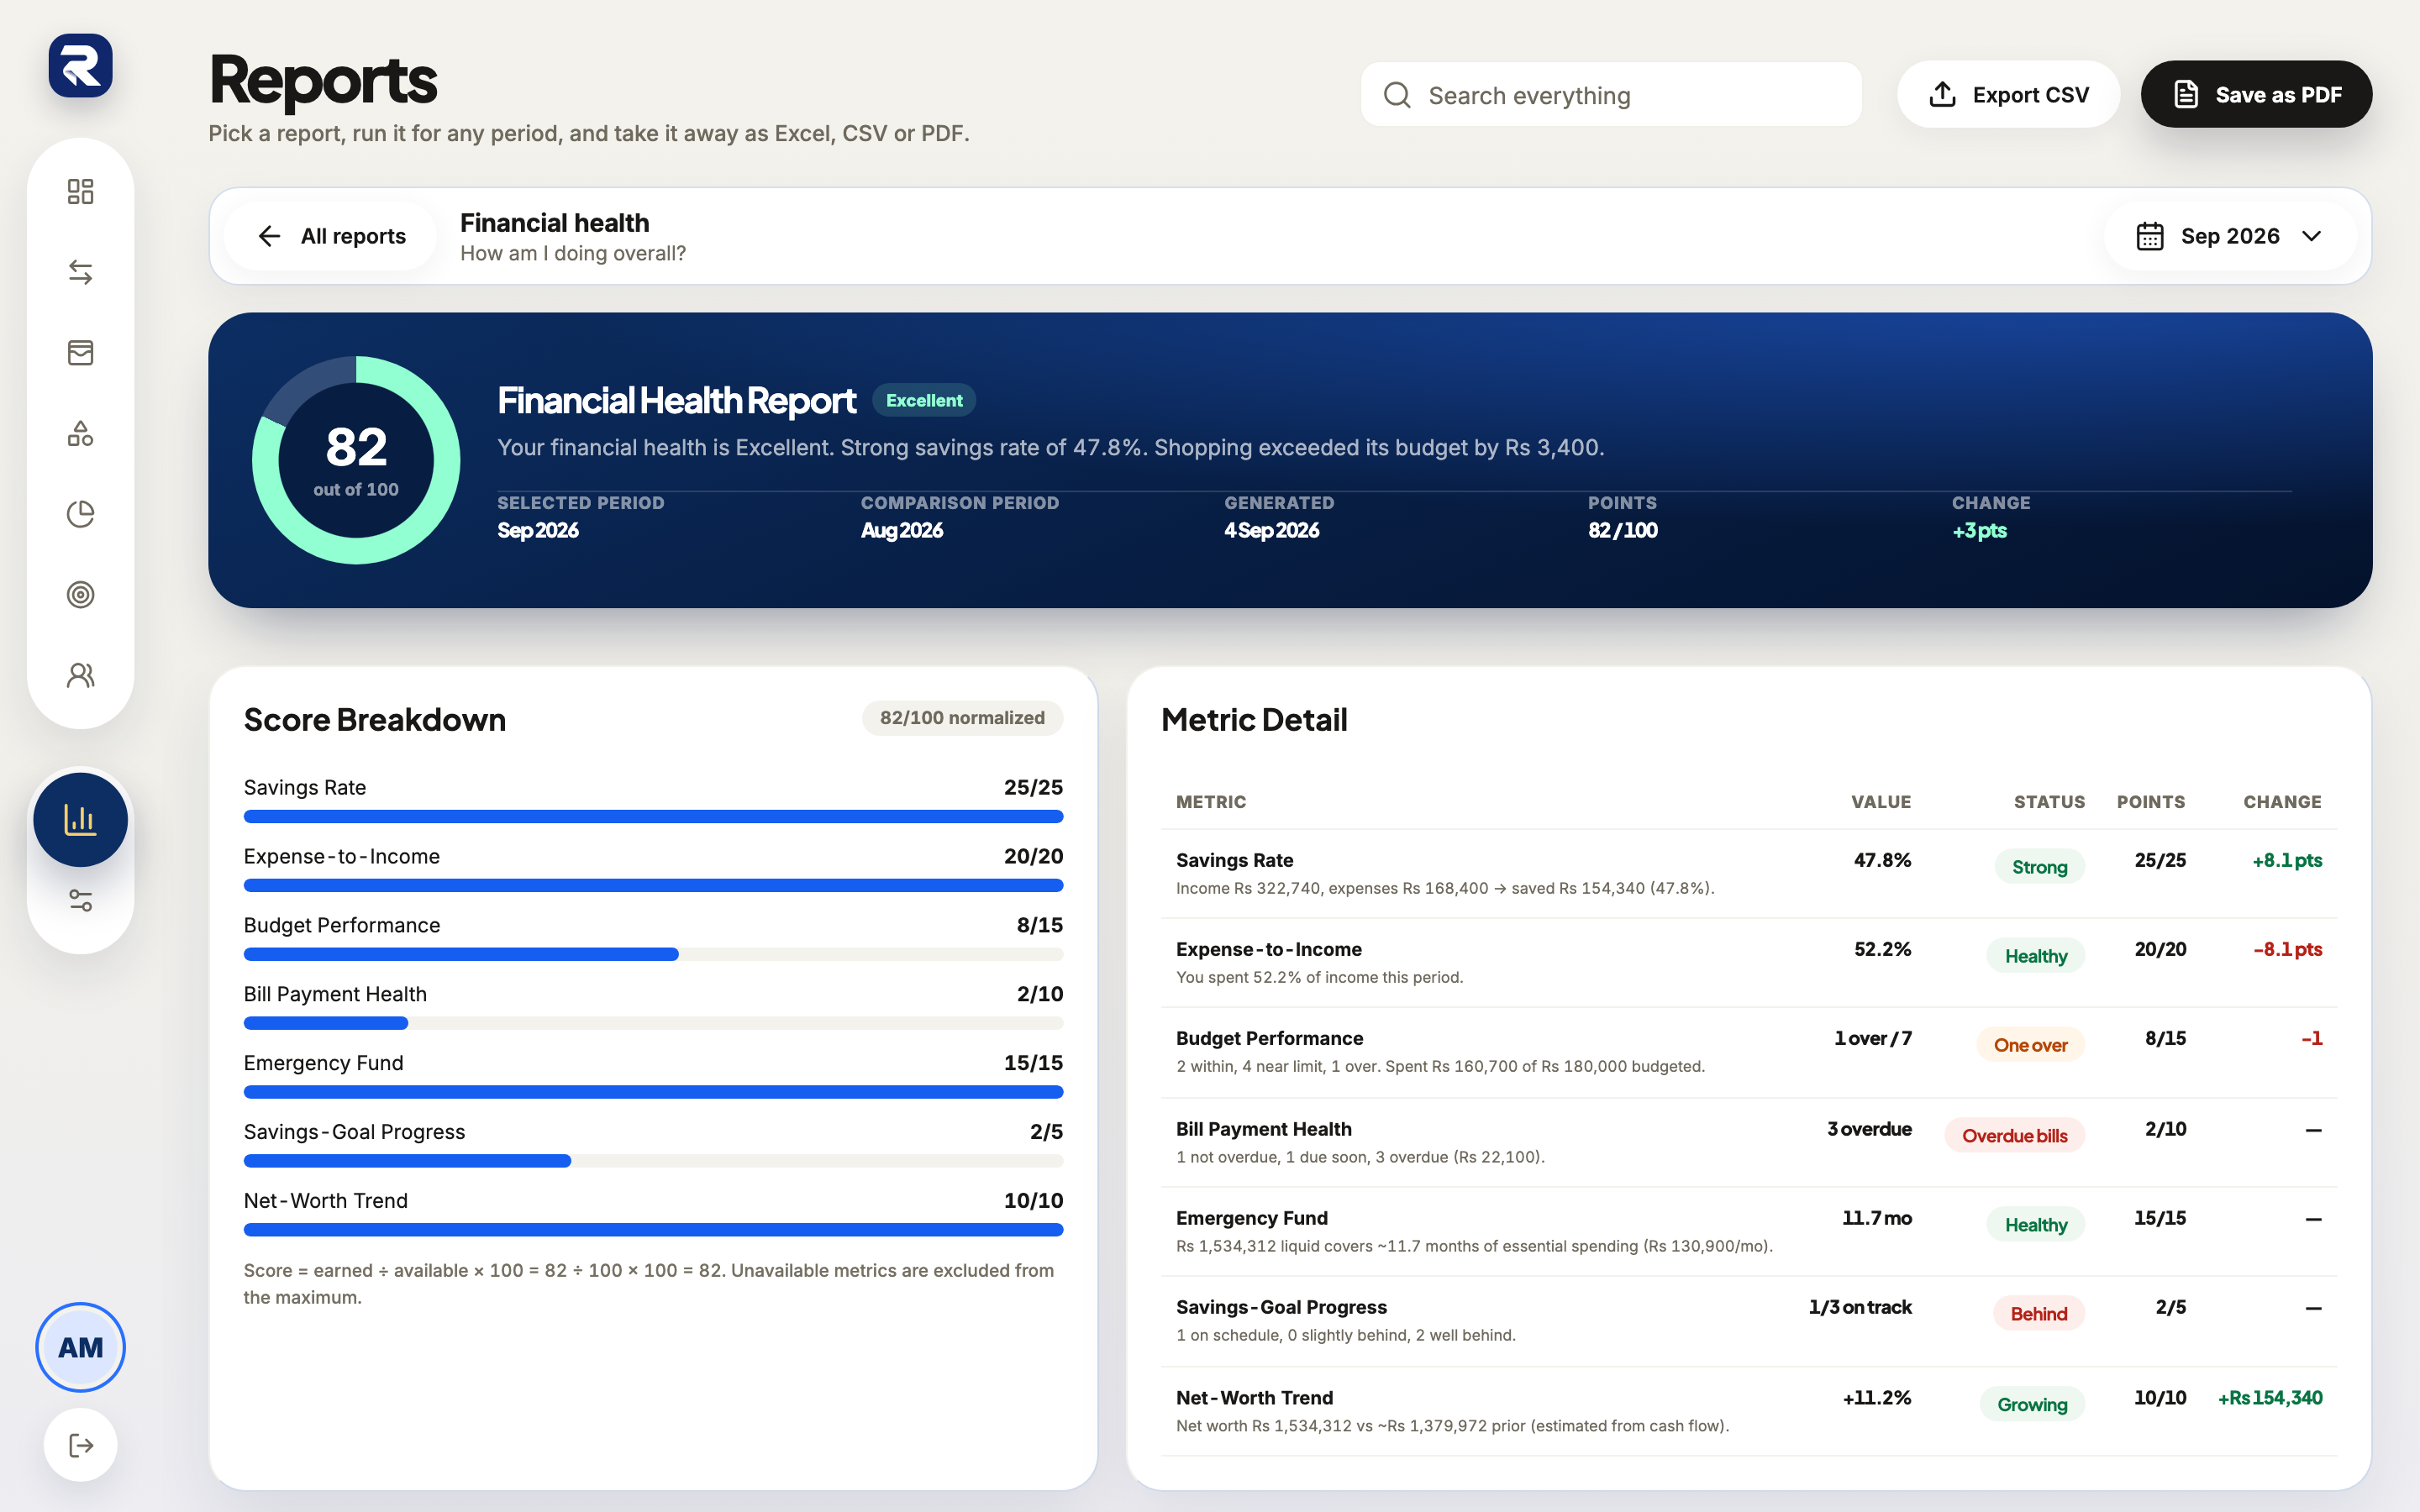 Savings Rate
Rakama excludes linked transfers from spending, from budgets, from the category breakdown and from month-on-month comparisons. That is worth knowing precisely, because it means the income and spending figures you are dividing are already free of the most common contaminant.
Four things that break it
A month with an unusual arrival
A tax refund, a bonus, a committee payout recorded as income. Any of these inflates the denominator for one month and produces a savings rate you will never see again. Compute over twelve months, or exclude the item and note that you did.
An expense straddling a month boundary
Paying an annual insurance premium in one month makes that month look terrible and the following eleven look excellent. The annual figure is fine; the monthly ones are theatre.
Recording a transfer as income
The single most damaging error, because it adds to the denominator without adding to the numerator — your rate falls while nothing real has happened. Committee payouts, loan proceeds and repayments received are the usual culprits.
Spending from money earned earlier
A month with no income and normal spending produces a negative savings rate, which is arithmetically correct and analytically useless. For a variable income this happens routinely, and it is the reason the rate should be read annually rather than monthly.
Reading it over time
Twelve months rolling, updated quarterly. Not a monthly figure, and not a calendar-year one — a rolling window absorbs the seasonality that would otherwise make a strong quarter look like a trend.
- Compare only against your own history. A published benchmark assumes a cost of living and a currency that may be nothing like yours.
- A rate that is stable while your income rises means your spending rose in proportion. That is worth noticing — it is lifestyle inflation with a number attached.
- A falling rate during a period of high inflation is not necessarily a failure of discipline. Prices rose faster than income; the rate is telling you the truth.
- A rising rate during a bad income year usually means you cut hard. Worth acknowledging rather than assuming it will hold.
The point of the figure is not to hit a target somebody published. It is to have one number that means the same thing in five years as it does today, so that the question “is this getting better?” has an answer that does not depend on what the currency did in between.
Frequently asked questions
What is a savings rate?
The share of your income you did not spend, in a given period. Money saved divided by money earned, both measured over the same months.
Why is the savings rate better than tracking how much I save?
Because it is a ratio. Inflation, currency moves and a variable income change both sides together, so the ratio stays comparable when the amounts do not.
Do transfers count as saving?
No. Moving money between your own accounts is not saving — the money was already yours. Only income you did not spend counts.
What is a good savings rate?
The one that is higher than yours was last year. Published benchmarks assume a cost of living and a currency that may have nothing to do with yours.
Make your money easier to understand.
Track expenses, plan budgets, and keep your goals in one clear view with Rakama.
Try Rakama free ↗